Three questions, one number.
A pay-gap figure is often asked to do three jobs at once. Each job has its own analysis and its own limits.
| Question | Starting analysis | What it does not establish |
|---|---|---|
| How do pay outcomes differ across the workforce? | Unadjusted means, medians, distributions and representation | Equal pay for comparable work, or a causal explanation |
| Are people doing the same or equal-value work paid consistently? | Validated job evaluation, comparable groups and individual review | That every remaining difference is justified |
| What difference remains once specified characteristics are held constant? | A documented statistical model with sensitivity analysis | A definitive causal or legal measure of discrimination |
Compensation Explorer answers the first question and helps you explore groups for the second. It does not estimate a regression, run a decomposition or produce a statutory return. Blau and Kahn's 2017 review finds that occupation, industry, career interruptions and working hours explain a large part of observed gaps, while experimental evidence means discrimination cannot be dismissed. None of that supplies a ready-made model for one German employer or an explanation for one person's pay.
The formula and its denominator.
M is the men's statistic and F the women's, among valid observations under the same pay measure and filters.
Mean gap100 × (M − F) ÷ M
Men’s mean 60,000, women’s mean 54,000: a gap of 10%. Positive means women earn less, negative means more. A zero male denominator makes the ratio undefined, not zero.
Median gap100 × (median M − median F) ÷ median M
The same formula with the two medians. It is the default in the visual and less sensitive to a few very high salaries. Report both when they differ. The difference itself is information about the distribution.
The raise that would close it100 × (M − F) ÷ F
Raising 54,000 to 60,000 needs 11.1%, not 10%, because the denominator changed. Say which one you mean.
Source: Workforce Studio, constructed example
Composition can hide or create a gap.
Equal pay inside every job and a large overall gap can both be true at the same time. They answer different questions.
- men
- women
Source: Workforce Studio, constructed example
Within each job group the gap is zero. Overall, men earn a mean of 72,000 and women 48,000, a gap of 33.3%, because men hold most of the higher-paid work. The overall figure does not prove unequal pay within jobs, and the zero within-job gap does not prove the organisation is equitable. Access to higher-paid work may still need investigation.
The reverse happens too. Similar averages can hide substantial differences within comparable groups. Always inspect both the composition and the within-group pay.
Trends move without pay moving. Hires, leavers, promotions and transfers change the overall gap even when nobody's pay changes. Report like-for-like changes and composition changes separately. A lower headline is not proof that a remedy worked.
Do not average the gaps. Averaging job-level percentage gaps does not reproduce the overall gap. Compute each statistic from its own defined population.
Comparable work before explanations.
A shared job title or grade is a starting point, not proof of equal work or equal value. Review the work itself against gender-neutral criteria: skills, the knowledge and abilities the work requires, however acquired. Effort, the physical, mental and emotional demands. Responsibility for people, resources, information and outcomes. Working conditions, the environment, hours patterns and risks. Simple classifications tend to undervalue the interpersonal and care-related demands, so look for them deliberately.
Our recommended review separates four things: the factual difference, the proposed explanation, the evidence behind it and the decision. Relevant experience, objective performance, a location policy or a progression step may be legitimate. They are not legitimate simply because a database column exists. Check consistency, relevance, measurement quality and potential bias.
An adjusted gap is a model, not a verdict.
An adjusted analysis asks what difference remains once chosen characteristics are held constant. The answer depends on the characteristics you chose.
A common specificationln(pay) = α + β · Female + X′γ + ε
X holds carefully selected job-value, location, experience and employment characteristics. With no interactions, 100 × (1 − exp(β)) is the modelled female shortfall. For β = −0.05 that is about 4.88%, not exactly 5%.
What adjusted meansconditional on the chosen model
Adding a current grade or performance score changes the question, because those variables may themselves reflect unequal opportunity. A small coefficient does not establish absence of unequal treatment. A large one does not identify which decisions caused it.
DecompositionΔ = (X̄m − X̄f)′ β* + …
Splits a mean gap into a part linked to measured characteristics and a part linked to different returns on them. “Explained” is a statistical label, not a finding that the factors are fair. “Unexplained” is not a direct discrimination estimate.
Source: Workforce Studio, constructed example
The unadjusted gap describes outcomes across the whole workforce. The adjusted gap is what remains after the chosen characteristics are held constant. Change the characteristics and the second number changes with them. If you commission an adjusted analysis, insist on the following.
- Specify first. Pay concept, population and intended interpretation before anyone looks at the gender coefficient. Keep the unadjusted results alongside.
- Audit the predictors. A grade or performance score may itself be affected by unequal opportunity. Adding it changes the question.
- Check common support. A job with only men or only women relies on other groups or on modelling assumptions. Very fine categories remove comparators.
- Document the data. Missingness, zero pay, outliers and exclusions. Logs cannot take zero, and adding one euro to avoid an error is not a fix.
- Review the model. Functional form, interactions, collinearity, residual patterns, and uncertainty that respects repeated observations of the same people.
- Prespecify sensitivity. Publish a set of reasonable alternative specifications and explain the differences. Never pick the one with the smallest gap.
- Get qualified review. A qualified analyst reviews data and model. Reward and legal specialists review explanations and consequences. Keep code and inputs reproducible.
- Use it to ask questions. Occupational distribution, progression, within-role differences. Never turn a decomposition into an automatic individual salary adjustment.
Switzerland's Logib framework is a useful methodological reference for a regression-based review with prescribed data preparation. It is not evidence that the visual implements it, and Swiss thresholds are not German compliance.
Small groups, uncertainty and confidentiality.
A census is a fact about the dataset. For a complete employee census the observed gap is real arithmetic, subject to data errors and definitions. Confidence intervals address an assumed broader population or process. A large headcount does not remove bias from inconsistent pay definitions or missing workers.
Significance is not importance. If you use inference, state the target population, the dependence assumptions, the estimator and the interval. A non-significant result in a small group is not proof of equality. Many subgroup searches produce striking results by chance, so prespecify priorities and disclose exploration.
Set a disclosure threshold. Agree a minimum disclosed cell size with data protection and employee representatives, then test complementary suppression and drill-down paths so a small group cannot be reconstructed.
Hiding is not access control. Collapsing detail or hiding a tooltip is presentation. The visual shows employee dots and cards and must only receive data its audience may see. Use Power BI permissions and a separate aggregate report for wider audiences.
The EU Pay Transparency Directive.
Directive (EU) 2023/970 requires objective, gender-neutral equal-value criteria and staged pay reporting by employer size. The table is limited to the cited EU text.
| Article | What it requires | What it does not mean |
|---|---|---|
| Art. 4 | Objective, gender-neutral criteria for equal value: skills, effort, responsibility and working conditions. | That a shared grade proves equal value. |
| Art. 9 | Pay reporting: 250 or more workers annually from 7 June 2027, 150 to 249 every three years from then, 100 to 149 every three years from 7 June 2031. | That an annual FTE dashboard is the statutory return. |
| Art. 10 | A joint pay assessment when a category gap of at least 5% has no objective gender-neutral justification and is not remedied within six months of reporting. | That 5% is a general lawful tolerance, or an automatic discrimination verdict. |
| Art. 34 | Transposition into national law by 7 June 2026. | That this guide establishes the implementation status in Germany or your filing obligations. |
From diagnosis to a defensible plan.
A finding without an owner is a finding that recurs. Record every issue the same way.
| Field | What to write down |
|---|---|
| Issue | The difference as observed, with measure, dates and population. |
| Affected population | Who, how many, which groups. |
| Evidence | The data, the checks performed and the comparable-work review. |
| Explanation | The proposed legitimate reason, if any, and the evidence supporting it. |
| Remedy | The correction, within the applicable legal and employment framework. |
| Cost and owner | What it costs and who is responsible. |
| Review date | When recurrence is checked in hiring, promotion, performance and reward decisions. |
Fix the data first. Correct extraction and classification errors before anything else. Then investigate inconsistent offers, progression, incentive eligibility and discretionary awards.
Never close a gap by cutting pay. Address unjustified differences under the applicable framework. Reducing someone else's pay to narrow a number cosmetically is not a remedy.
Publishing a number is not transparency. Communicate the method, the uncertainty and the planned action in language employees understand. Horizontal, vertical and cross-firm transparency have different effects and trade-offs.
How Compensation Explorer applies this.
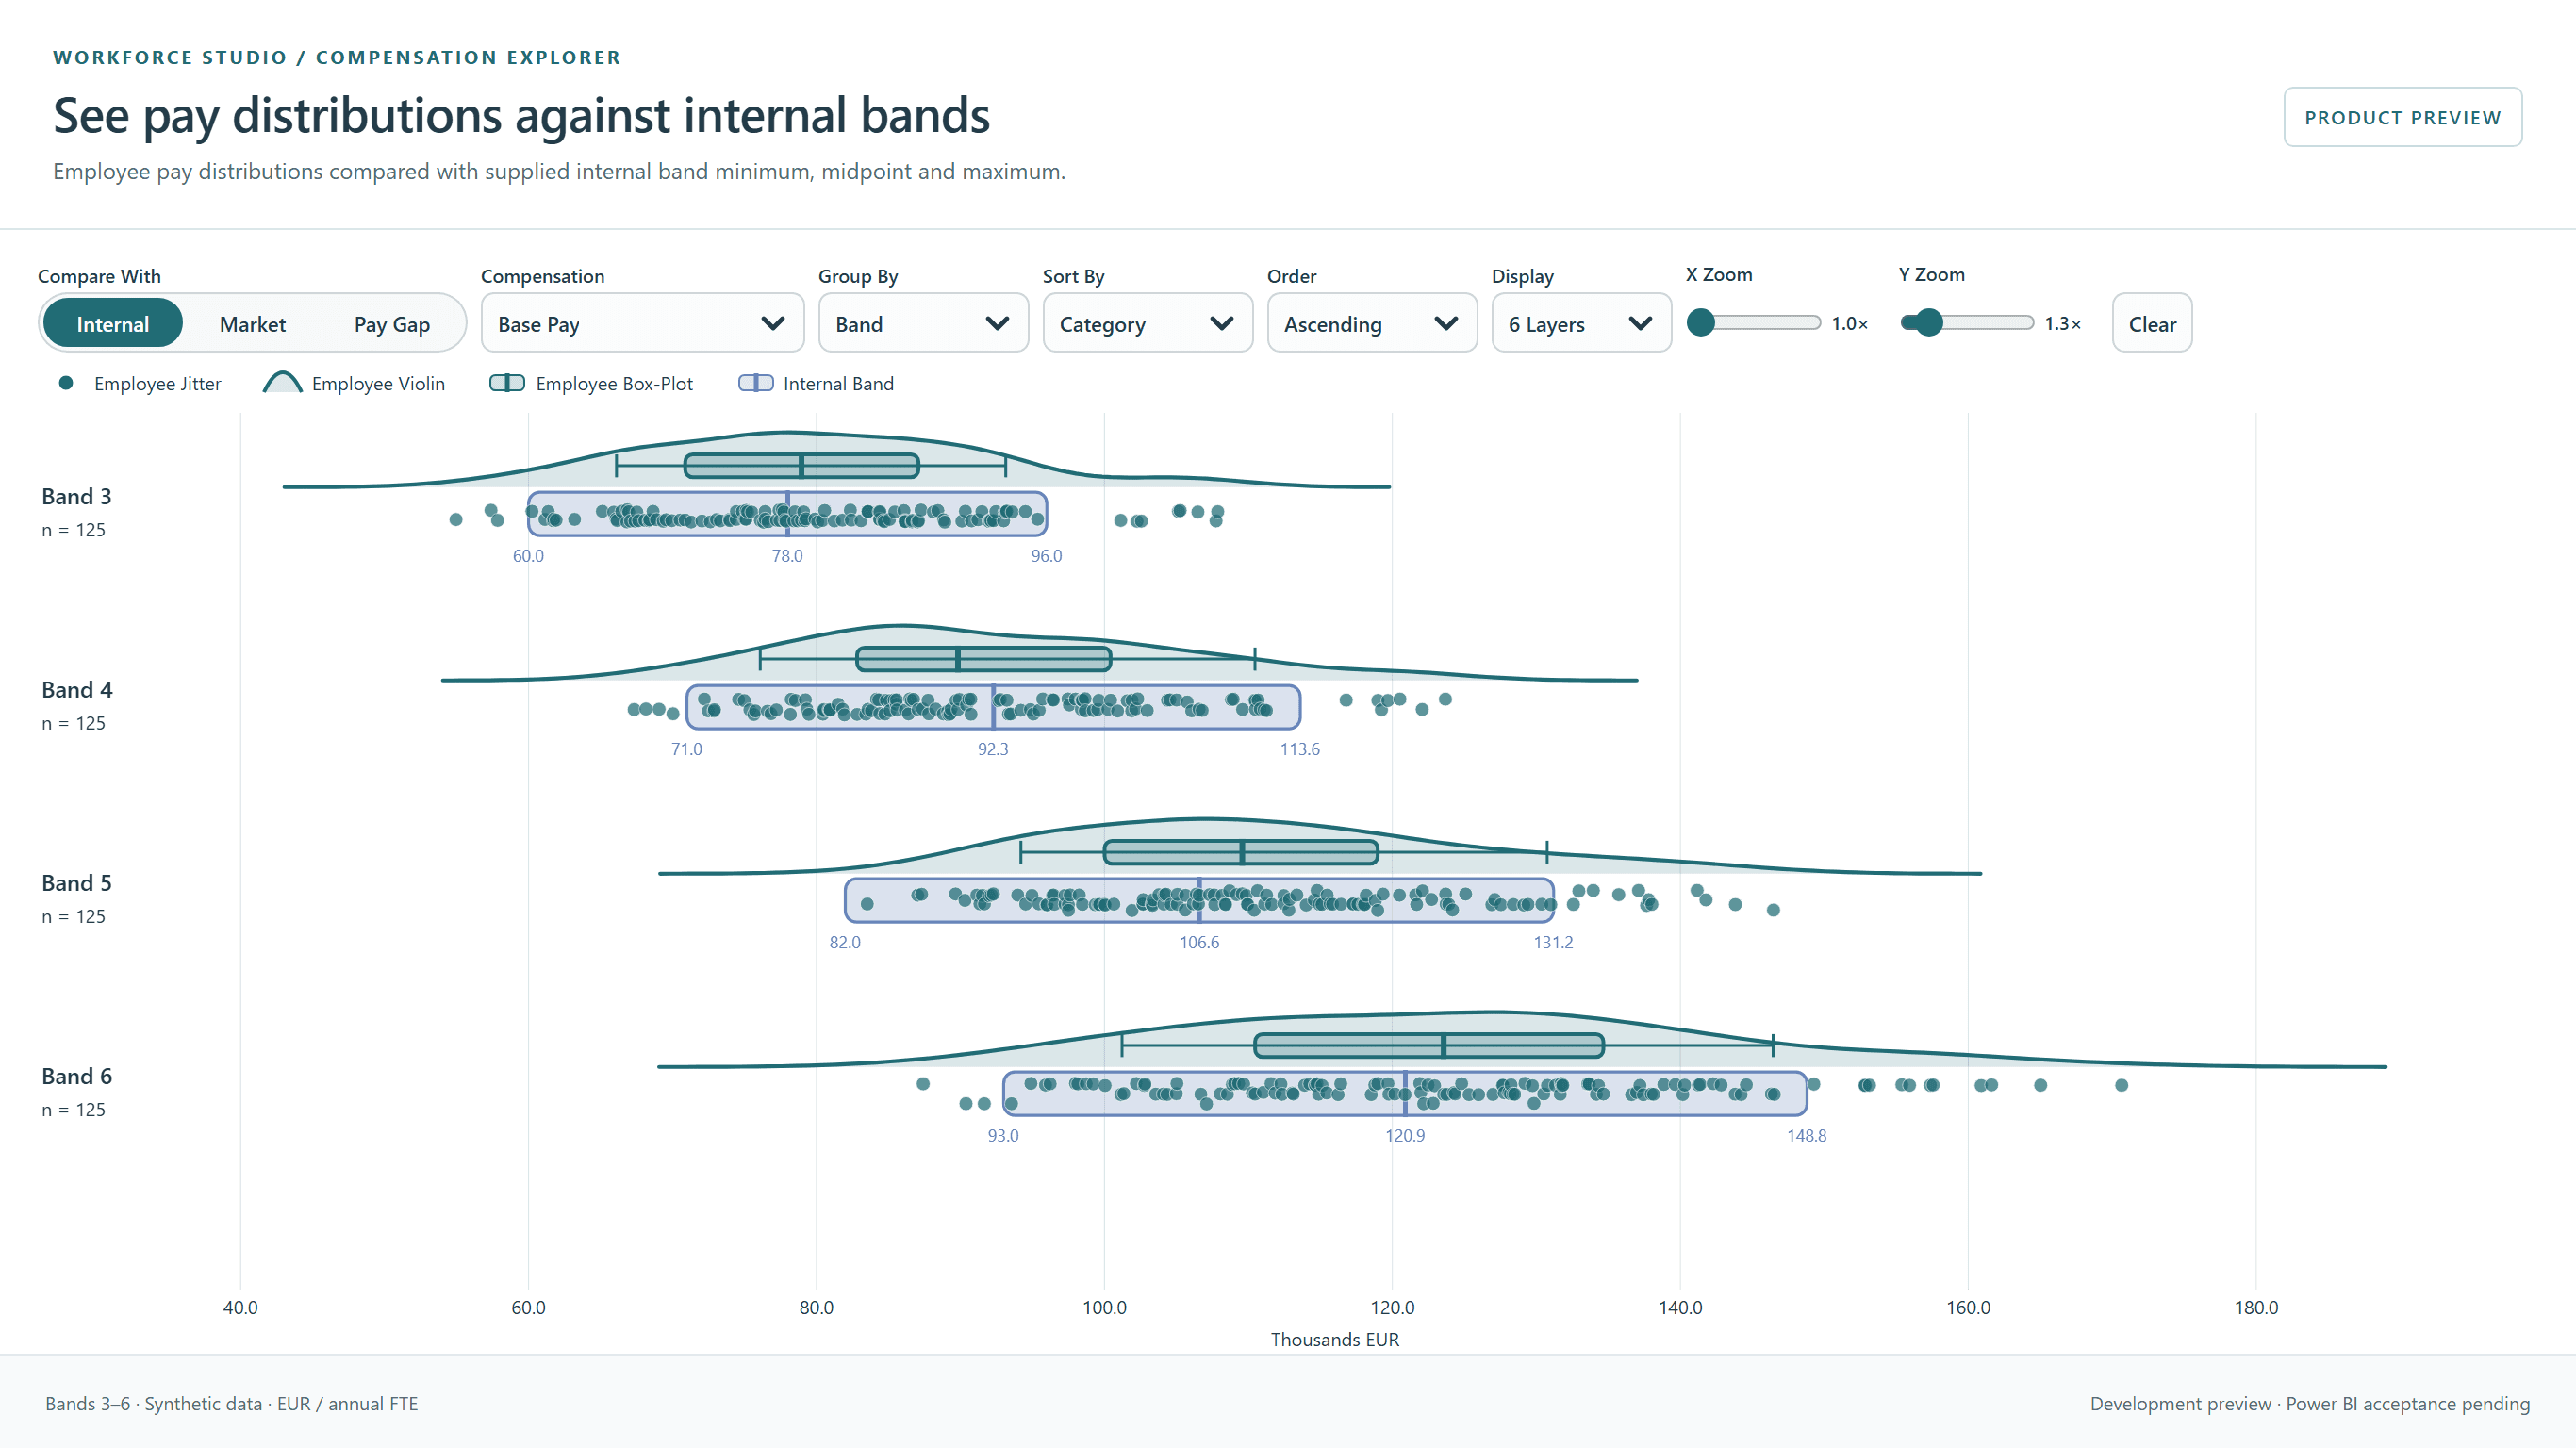
- The Pay Gap view compares the selected pay measure among valid Female and Male observations in the current filter context, by median by default or by mean. Positive means women earn less.
- Gender is read as Female, Male, Other or Unknown, case-insensitive, and never inferred from names. Other and Unknown stay visible as categories and are excluded only from the binary gap.
- The view needs at least one woman and one man with valid pay in the filtered population. Totals are recomputed from employees, not averaged from groups.
- It does not adjust for job value, experience or hours, and it is not an hourly statutory return, a compliance certificate or a causal estimate. Use it to find and communicate differences, then investigate with the methods that fit the question.
The full text, with every source
This guide distils the methodology behind Compensation Explorer. The complete text, with a citation beside each claim, is available here for anyone who wants to check the reasoning. Edition 1.9.0.0, 2 October 2026. The source register lists every reference.
Read the full text · 10 min
1. Separate three questions
| Question | Suitable starting analysis | What it does not establish |
|---|---|---|
| How do pay outcomes differ across the workforce? | Unadjusted means, medians, distributions and representation | Equal pay for comparable work or a causal explanation |
| Are people doing the same or equal-value work paid consistently? | Validated job evaluation, comparable groups and individual review | That all remaining differences are justified |
| What difference remains conditional on specified observed characteristics? | A documented statistical model and sensitivity analysis | A definitive causal or legal measure of discrimination |
The current visual answers the first question and helps explore groups for the second. It does not estimate a regression, conduct an Oaxaca–Blinder decomposition or produce a statutory reporting return.
Blau and Kahn's review identifies the continuing importance of occupation, industry, work interruptions and working hours, while experimental evidence means discrimination cannot be dismissed. Its primary empirical context is the US. The research does not supply a ready-made German employer model or an explanation for an individual employee's pay. Blau & Kahn (2017), JEL 55(3), 789–865.
2. Write the estimand and denominator
For the displayed female/male comparison, let M be the mean male pay and F the mean female pay among valid observations under the same measure and filters:
Mean gap (%) = 100 × (M − F) / M.
The median gap substitutes the two medians. Positive means female pay is lower relative to the male denominator. Negative means it is higher. With M = €60,000 and F = €54,000 the gap is 10%. Raising €54,000 to €60,000 requires 11.11% of female pay: the percentages differ because the denominator differs. With a zero male denominator the ratio is undefined, not zero.
Eurostat's unadjusted gender pay gap uses average gross hourly earnings, with a defined statistical population. ONS's principal ASHE comparison uses median hourly earnings excluding overtime. These figures cannot be compared directly with an employer's annual FTE mean gap merely because each is called a gender pay gap. Eurostat metadata, ONS interpretation guide.
Report at least the measure, dates, population, group counts, mean/median, missingness and exclusions. Analyse base, target opportunity and actual outcomes separately. Bonus analysis should distinguish eligibility, receipt, zero awards, target percentage and payout relative to target. A recipients-only median can look equal despite unequal access to bonus plans.
The visual reads Female, Male, Other and Unknown categories without inferring them from names. Its binary gap uses valid Female and Male observations. Other/Unknown are retained as categories and do not become fabricated male/female records. Verify the displayed counts and the data dictionary. The appropriate legally reportable sex/gender variable and treatment of categories require a separate decision for the applicable reporting regime.
3. A constructed example: composition and within-job differences
| Comparable job group | Men | Women | Pay of every person in the group |
|---|---|---|---|
| Higher-paid work | 8 | 2 | €80,000 |
| Lower-paid work | 2 | 8 | €40,000 |
Men's mean is €72,000. Women's mean €48,000. The overall gap is 33.33%. Within each job group the gap is zero. This does not prove that the organisation is equitable: access to higher-paid work may still require investigation. Nor does the overall 33.33% prove unequal pay within each job. Both observations are true and answer different questions.
Reverse patterns can also occur: aggregate similarity can hide substantial differences within comparable groups. Always inspect both composition and within-group pay. Do not average job-level percentage gaps as if that necessarily reproduced the overall gap. Calculate each target statistic from its defined population.
An overall gap can change when people are hired, leave, are promoted or move between groups, even without anyone's pay changing. Present like-for-like employee changes and workforce-composition changes separately when explaining trends. A lower headline gap is not, by itself, evidence that a remediation policy worked.
4. Build comparable-work groups before explaining differences
A shared job title or grade is a starting point, not proof of equal work or equal value. Review skills, effort, responsibility and working conditions, including interpersonal and care-related demands that simplistic job classifications can undervalue. Apply criteria to work rather than to the demographic profile of its incumbent. ILO provides a practical gender-neutral job-evaluation method. ILO guide.
Our recommended review separates the factual difference, the proposed explanation, the evidence supporting it and the decision. Relevant experience, objective performance, location policy or a progression step may be pertinent. They are not automatically legitimate just because a database column exists. Check consistency, relevance, measurement quality and potential bias. Prior salary or negotiation history can perpetuate earlier differences. Do not use them as unquestioned fairness benchmarks.
Goldin's research emphasises the role of job structures that disproportionately reward long or particular hours. Consequently, merely dividing annual pay by an FTE factor need not remove all working-time-related differences. A practical review should consider access to flexible work, desirable assignments and promotion pathways alongside pay rates. Goldin (2014), AER 104(4), 1091–1119.
5. Adjusted analysis: a model specification, not a verdict
A common illustrative specification for positive hourly pay is:
ln(pay_i) = α + β·Female_i + X_i′γ + ε_i.
X might contain carefully selected job-value, location, experience and employment characteristics. With no interactions and the same X, 100 × (exp(β) − 1) expresses the modelled relative female/male difference on the log-pay scale. To express a positive female shortfall use 100 × (1 − exp(β)). For β = −0.05 that shortfall is about 4.88%, not exactly 5%. This concerns conditional geometric/log-scale comparison. Arithmetic-mean predictions need appropriate retransformation. Interactions make the comparison vary with X.
Logib provides an official Swiss operational framework, including a regression-based module with prescribed data preparation and a separate approach for smaller organisations. It is a useful methodological reference, not evidence that our visual implements it or that Swiss thresholds constitute German compliance. FOGE Logib FAQ, Module 1 guideline, version 2024.1.
Our recommended model-review procedure is:
- Specify the pay concept, population and intended interpretation before viewing the gender coefficient. Keep the original unadjusted results alongside the model.
- Audit predictors. A current grade or performance score may itself reflect unequal opportunity or biased assessment. Adding it changes the question from total differences to differences conditional on that potentially affected variable.
- Check common support. If a job has only men or only women, within-job comparisons rely on other groups or modelling assumptions. Extremely fine categories can remove meaningful comparators.
- Document missingness, zero pay, outliers and exclusions. Logs cannot include zero. Do not add €1 merely to avoid a software error. For bonus data, a participation/receipt model and a conditional amount model may be more informative.
- Review functional form, interactions, collinearity and residual patterns. Match uncertainty estimation to the sampling/dependence structure. Repeated employee observations are not independent new people.
- Publish a prespecified set of reasonable sensitivity specifications and explain differences. Do not select the model that produces the smallest or least significant gap.
- Have a qualified analyst review the data and model, and reward/legal specialists review proposed explanations and consequences. Keep code and versioned inputs reproducible under appropriate access controls.
These are analytical recommendations, not claims that the present dashboard has executed these steps. “Adjusted” means conditional on the chosen model. Omitted variables, measurement error, selection and modelling choices can change the residual difference. A small coefficient does not establish absence of unequal treatment. A large coefficient does not identify which individual decisions caused it.
6. Decomposition answers another question
For group-specific linear models of mean log pay, a twofold decomposition with chosen reference coefficients β* can be written:
Δ = (X̄_m − X̄_f)′β* + X̄_m′(β_m − β*) + X̄_f′(β* − β_f).
The first term is the part associated with differences in measured characteristics under the reference returns. The remaining terms reflect coefficient differences. Include the intercept in X. Choice of reference coefficients affects the split. Categorical predictors and detailed contributions need care. Jann provides the method and implementation issues. “Explained” is a statistical label, not a finding that the factors are fair. “unexplained” is not a direct discrimination estimate. Jann (2008), Stata Journal 8(4), 453–479.
The practical purpose is to identify questions for investigation, such as occupational distribution, progression or differences within a role. Do not turn a decomposition into an automatic individual salary adjustment. Individual decisions require case-level facts and the organisation's lawful pay rules.
7. Uncertainty, small groups and confidentiality
For a complete current employee census, the observed descriptive gap is a fact about that dataset, subject to data error and definitions. Sampling confidence intervals address an explicitly assumed broader population or process. They are not required to make the observed arithmetic real. Conversely, a large employee count does not remove bias from inconsistent pay definitions or missing workers.
If inferential analysis is used, state the target population, dependence assumptions, estimator and confidence interval. Statistical significance is different from practical importance. A non-significant result in a small group is not proof of equality. Many subgroup searches also increase the chance of striking results arising by chance. Prespecify priority comparisons and disclose exploratory work.
Privacy thresholds and statistical sufficiency are separate. Our recommended publication policy is to set a minimum disclosed cell size with the organisation's data-protection and employee-representative review, then test complementary suppression and drill-down paths. Hiding a tooltip or collapsing detail is not an access-control mechanism. The current visual supports employee dots and cards and must only receive information its audience is entitled to see. Use Power BI model/access controls and a suitable aggregate report for wider audiences.
8. Germany/EU legal context — limited to the cited EU instrument
Directive (EU) 2023/970 requires objective gender-neutral equal-value criteria (Art. 4). Its reporting timetable is: 250+ workers, annually from 7 June 2027. 150–249, every three years from that date. 100–149, every three years from 7 June 2031 (Art. 9). National rules may go further. The transposition deadline was 7 June 2026 (Art. 34). This guide has not established Germany's current implementation or your employer's filing obligations.
Art. 10's joint-assessment trigger combines a category-level average difference of at least 5%, absence of objective gender-neutral justification, and failure to remedy it within six months of reporting. 5% is not a general lawful tolerance or automatic discrimination verdict. A dashboard filter or regression result does not substitute for the required legal assessment. Directive text, Arts. 4, 9, 10 and 34.
9. From diagnosis to a defensible action plan
Our recommended action record identifies the issue, affected population, evidence, explanation, remedy, cost, owner and review date. Correct extraction/classification errors first. Investigate inconsistent offers, progression, incentive eligibility and discretionary awards. Address unjustified differences under the applicable legal and employment framework. Do not reduce someone else's pay to cosmetically close a gap. Track recurrence through hiring, promotion, performance and reward decisions.
Communicate the method, uncertainty and planned action in language employees can understand. Cullen's review distinguishes horizontal, vertical and cross-firm transparency, with differing effects and trade-offs. Publishing a number alone is therefore not a complete transparency policy. Cullen (2024), JEP 38(1), 153–180.
10. Required interpretation beside this visual
Unadjusted annual FTE pay comparison. The chart compares the selected pay measure among valid female and male observations in the current filter context. It does not adjust for job value, experience, hours patterns or other characteristics. It is not an hourly-pay statutory return, an equal-pay compliance certificate, or a causal estimate of discrimination. Use it to identify and communicate differences, then investigate them with the methods appropriate to the question.